Prometheus and Grafana
Prometheus is an open-source monitoring and alerting toolkit designed for reliability and scalability. It functions as a time series database that collects and stores metrics from monitored targets at regular intervals. Prometheus works on a pull-based model, where it scrapes HTTP endpoints exposed by services likebeacond or bera-reth. These services listen on dedicated ports and respond with metrics in a simple text-based format. For Berachain nodes, Prometheus is essential for tracking performance metrics, resource utilization, and operational health over time.
Grafana is a visualization and analytics platform often paired with Prometheus. While Prometheus collects and stores metrics, Grafana provides a powerful interface to query, visualize, and understand that data through customizable dashboards. It allows node operators to create graphs, charts, and alerts based on Prometheus metrics, making it easier to monitor node performance, identify issues, and track the health of Berachain nodes over time.
Setup
Grafana has commercial (“enterprise”) and open-source variants. Refer to its installation instructions. Prometheus is fully open-source. Refer to its installation instructions. Once installed, set up Grafana so that you can sign in as an administrator, and set up the Prometheus data source (by default onlocalhost:9100).
The following additional packages are recommended:
prometheus-blackbox-exportermonitors TCP and HTTP endpoints, providing Prometheus metricsprometheus-node-exportercollects operating system metrics from the host computerprometheus-alertmanagerto identify failure conditions and dispatch alerts
What to monitor
At minimum:- The public TCP/IP endpoints for your Beacon Kit, generally on port 26656.
- The public TCP/IP endpoint for your execution layer, usually on TCP port 30303.
- The block height for both of these.
- Operating system telemetry.
Monitoring service endpoints
The following Prometheus configuration sets up monitoring for TCP endpoints:/etc/prometheus/prometheus.yml
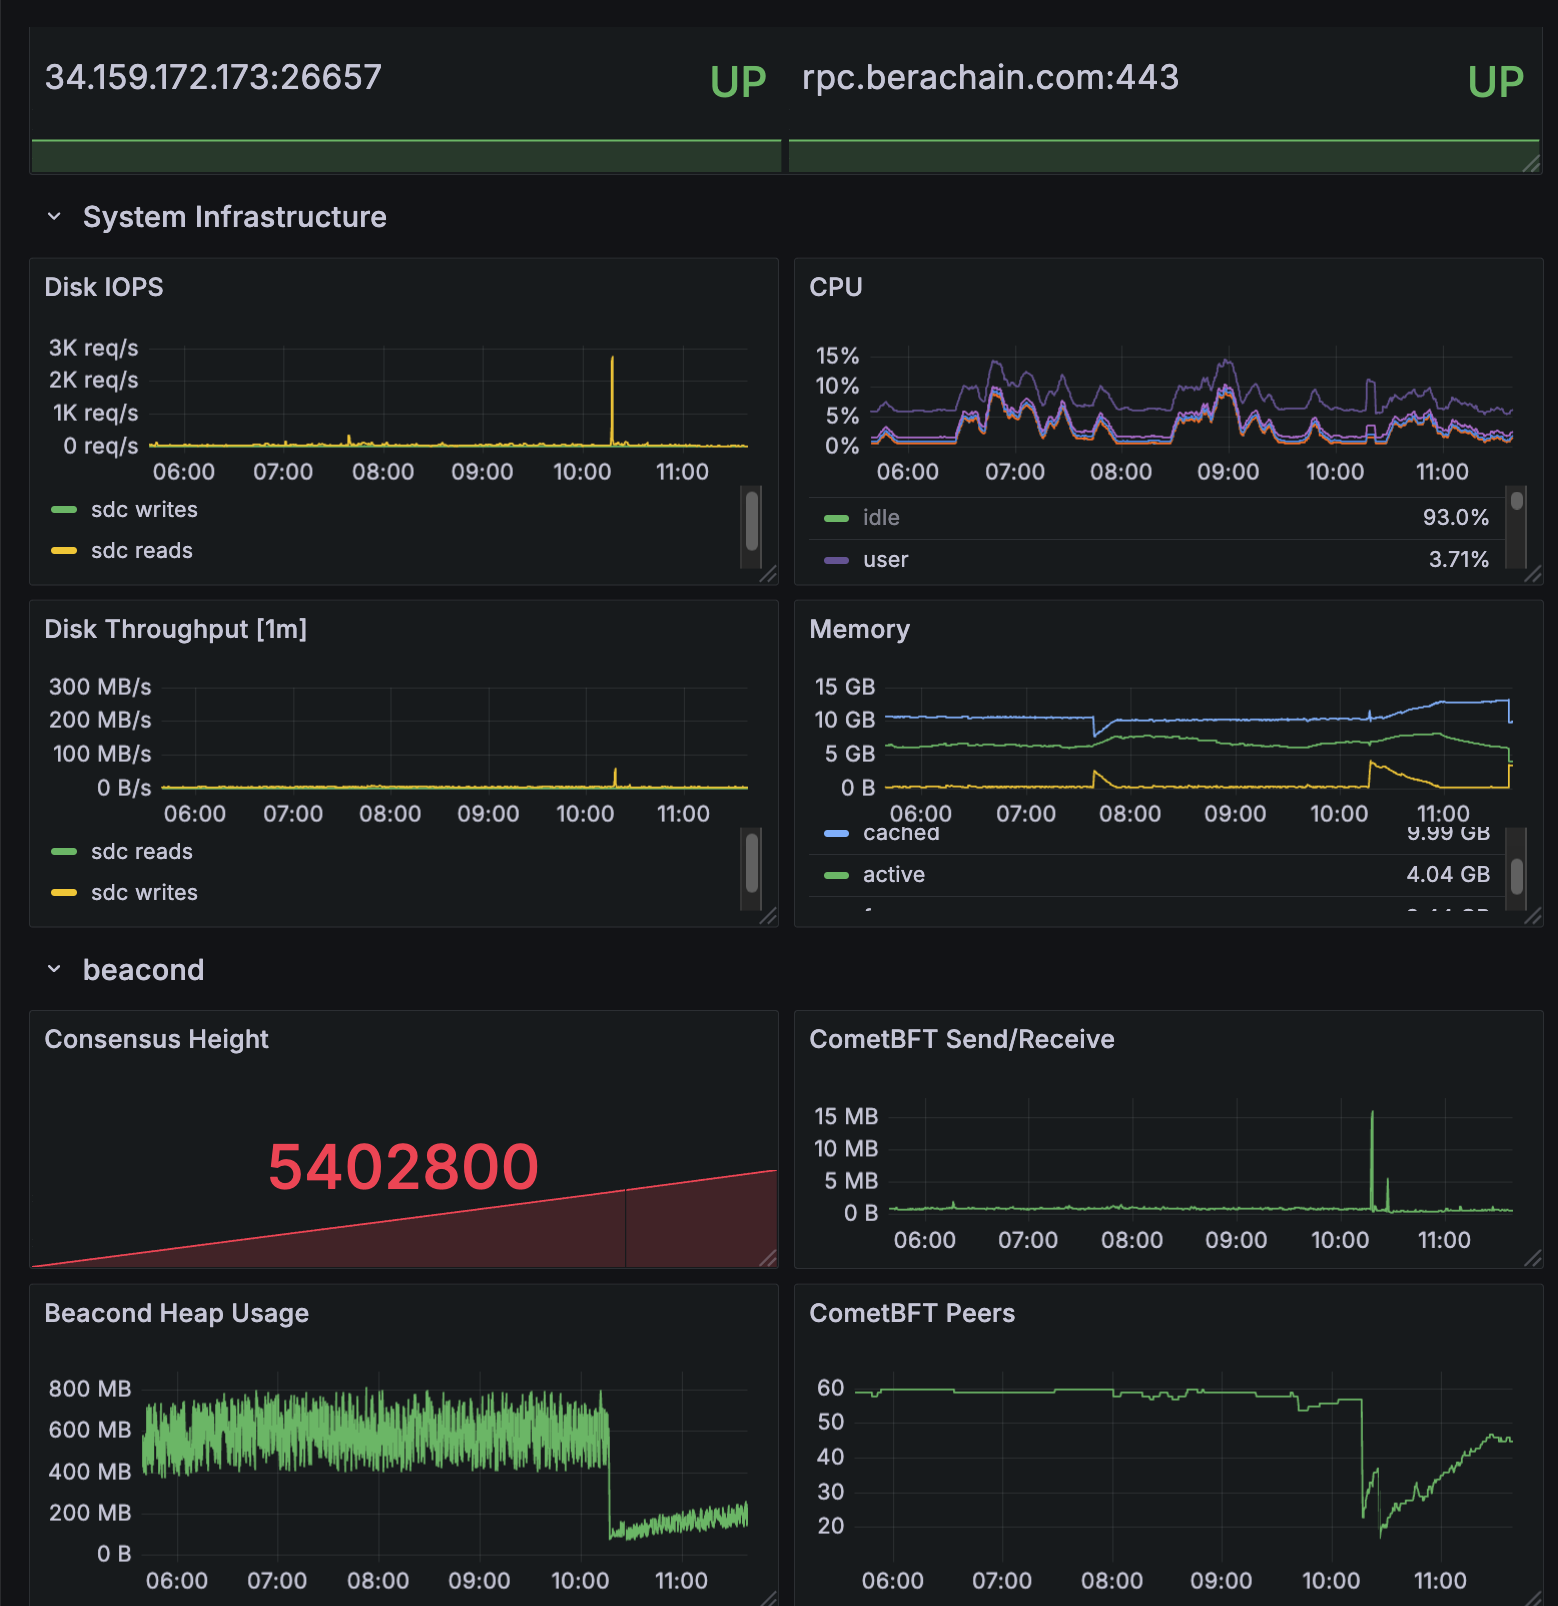
probe_success metric with a 0 or 1 value to indicate DOWN or UP.
Beacon-Kit metrics
Beacon-Kit must have the Prometheus instrumentation enabled. To do this, revise the configuration:config.toml
0.0.0.0.
Then, add this endpoint to Prometheus by referring to the metrics port:
/etc/prometheus/prometheus.yml
cometbft_consensus_height— the block height of the Beacon Chaincometbft_consensus_rounds— reports the number of consensus rounds CometBFT has gone through for the current block. This should normally not rise above 1.cometbft_p2p_message_receive_bytes_total(andcometbft_p2p_message_send_bytes_total) — show the network traffic received and sentcometbft_p2p_peers— the total (incoming + outgoing) peer connections tobeacond
Execution layer metrics
Bera-Reth allows you to enable metrics with these command line options:/metrics.
After restarting your EL to begin publishing metrics at your chosen port, add this endpoint to Prometheus:
/etc/prometheus/prometheus.yml
Reth metrics
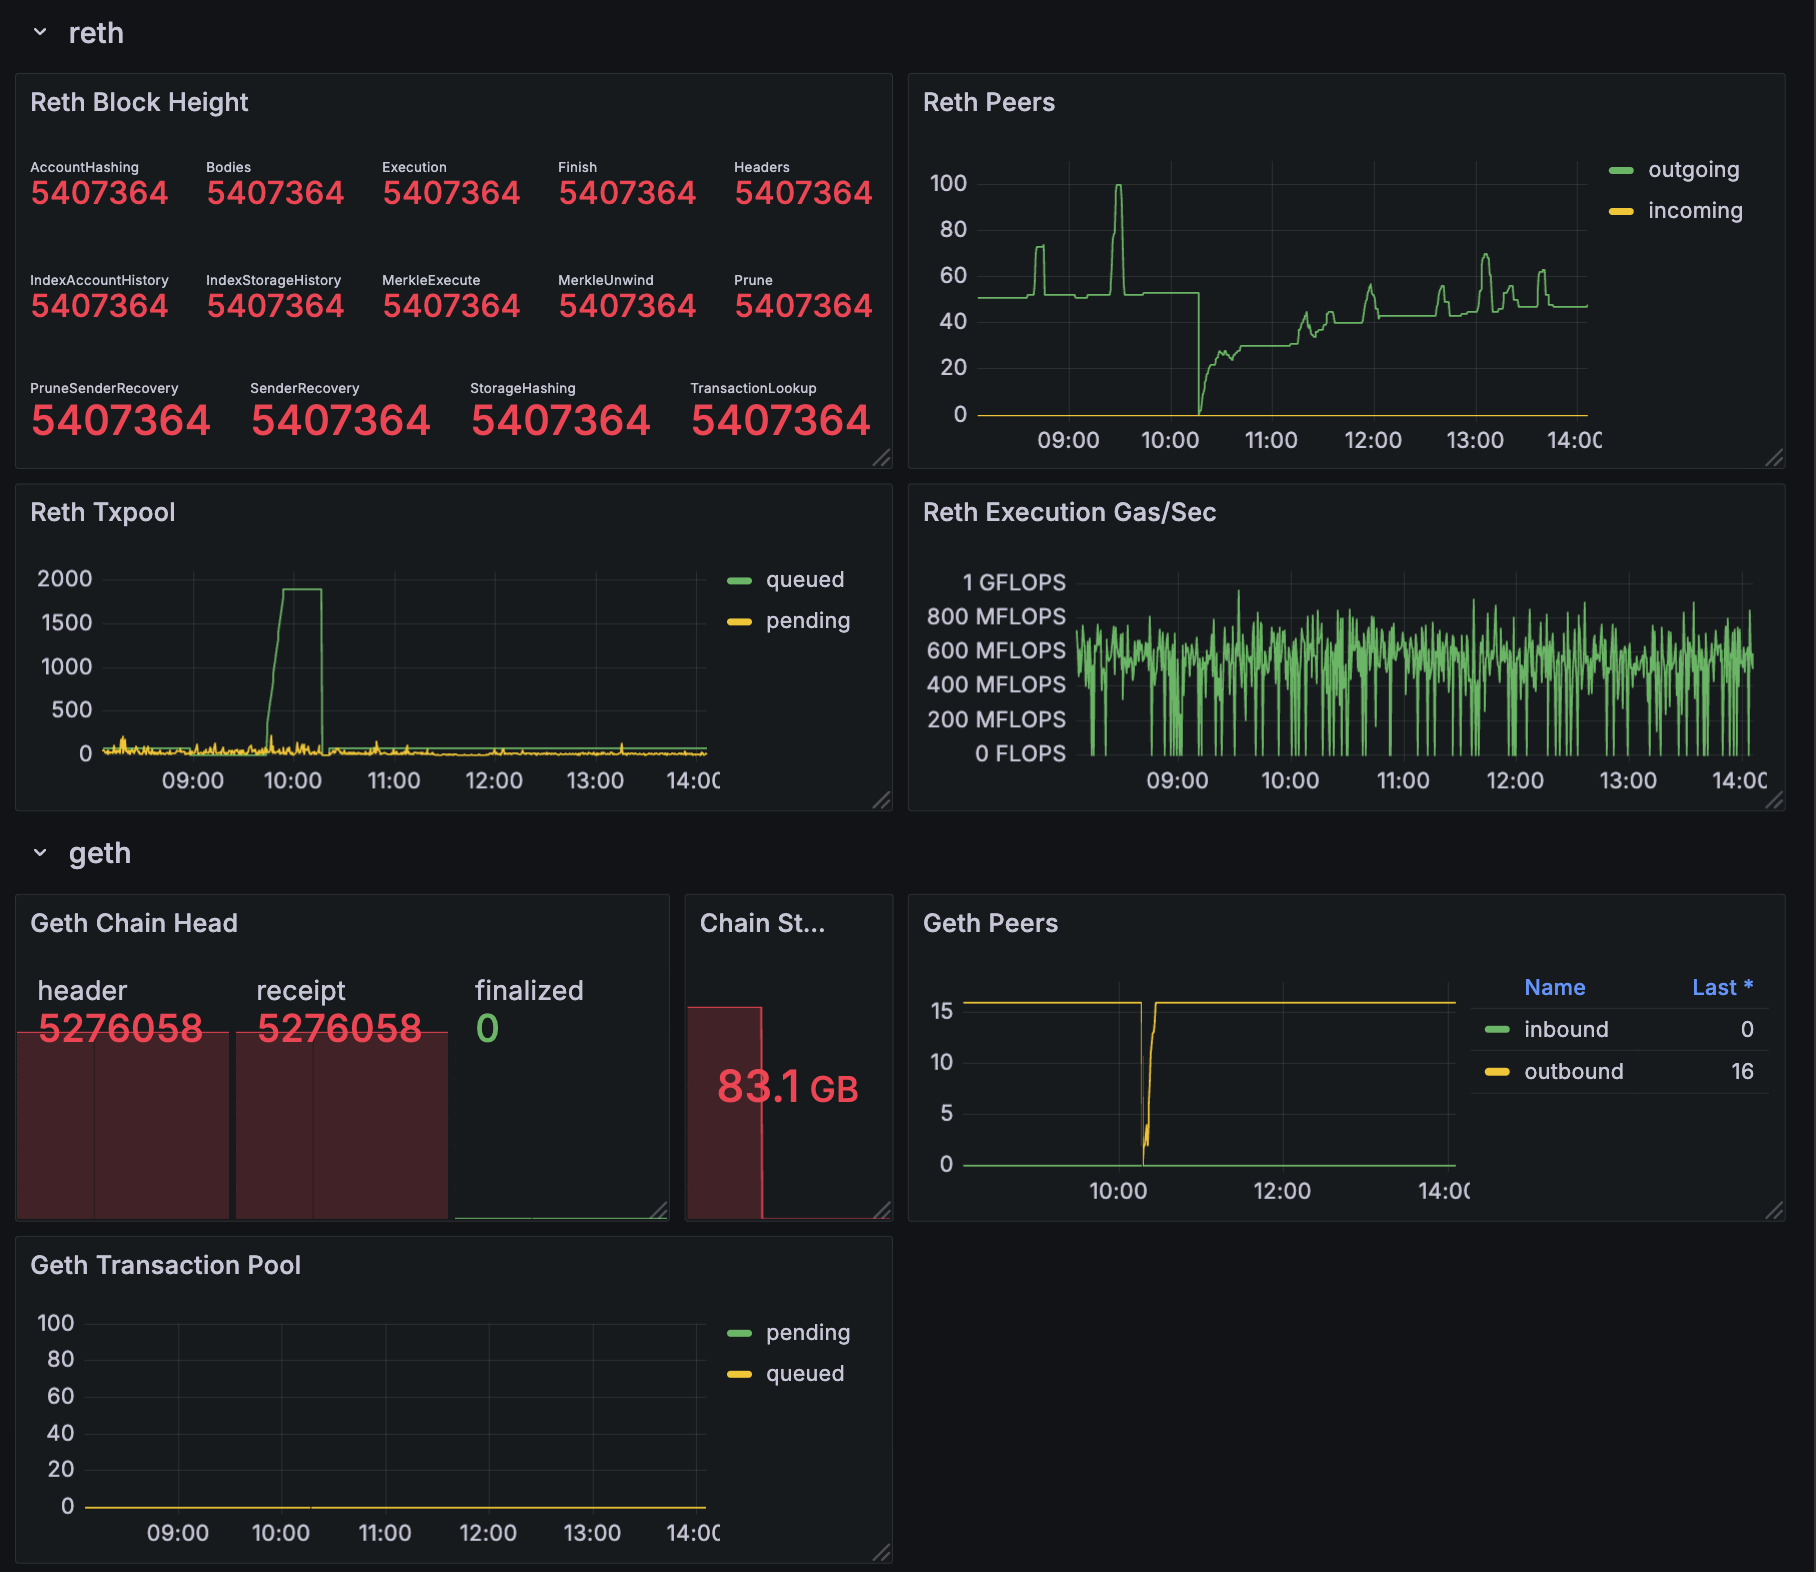
reth_sync_checkpoint— the chain height, with details available on the height/progress of every sync step (there are ~14)reth_network_outgoing_connectionsandreth_network_incoming_connections— the number of connections propagating transactions and blocksreth_transaction_pool_pending_pool_transactions— the number of transactions pending in the pool (waiting to be executed)reth_sync_execution_gas_per_second— the execution engine’s performance, measured in gas/sec
Sample dashboard
All of the above metrics are collected into a sample Grafana dashboard. If you would like to start with this dashboard as a basis for your system, download the dashboard description file — as a JSON file which can be imported into Grafana — at https://github.com/berachain/guides/tree/main/apps/grafana/sample-dashboard.json.